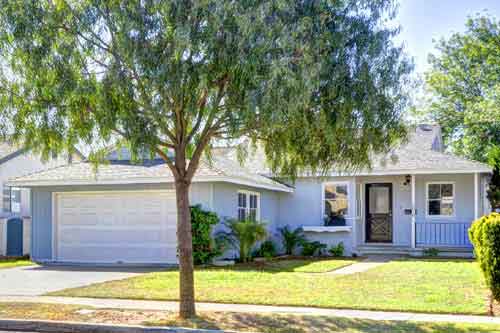
71 Home Sales in Torrance in October at an Average Price of over $1.1M!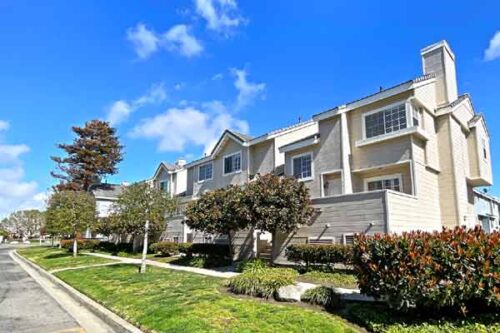
October 2023 was a bit slower than September with 21 fewer homes that sold, but prices were very impressive. There were 71 closed homee sales compared to an impressive 90 in September
List price averaged an impressive $1,072,892 with the average sold price at $1,100,411 which was a nice jump from the $1,034,044 a month earlier.
The average price per square foot for the homes that sold in was $720 and the average days on market was a very brief 21 before going into escrow. That’s about half the time it takes for a home to sell in the surrounding communities.
See how October Torrance real estate statess compared with other months.
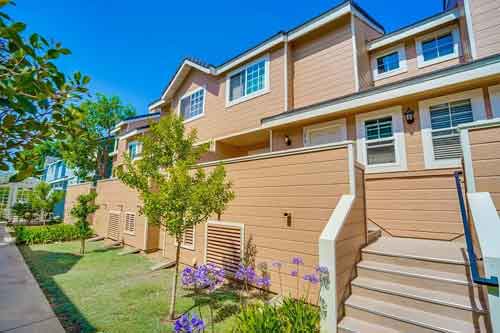
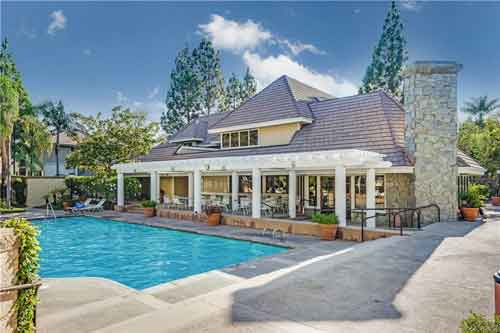
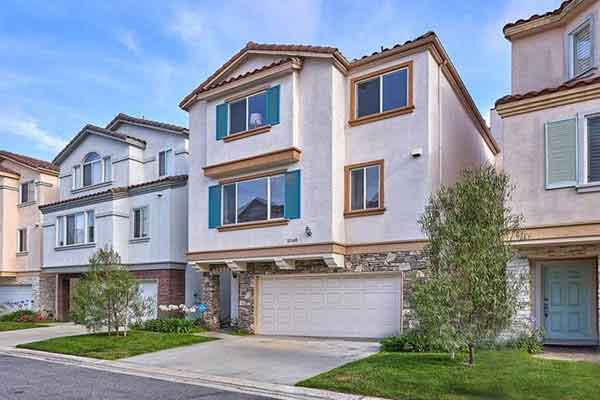
4 of the 71 homes that sold were in the gated communities of Plaza Del Amo (highlighted below)
- Search the current homes for sale throughout all of Torrance
- Search the Plaza Del Amo and central Torrance area homes
Torrance Home Sales and Prices for October 2023
| Home Type | Address | Price | $ Per Foot | Bed/Bath | Sq Feet | Age | |
| CONDO/A | 24410 | Crenshaw BLVD #225 | $470,000 | $465 | 2/2,0,0,0 | 1010/A | 1987/ASR |
| CONDO/A | 20561 S | Vermont Unit #4 AVE #4 | $490,000 | $506 | 2/2,0,0,0 | 968/A | 1982/ASR |
| SFR/D | 1570 W | 226th ST | $660,000 | $597 | 3/2,0,0,0 | 1106/A | 1951/ASR |
| SFR/D | 1545 W | 215th ST | $810,000 | $688 | 3/2,0,0,0 | 1178/A | 1945/SLR |
| SFR/D | 1325 W | 221st ST | $880,000 | $1,044 | 2/1,0,1,0 | 843/A | 1947/ASR |
| CONDO/A | 20565 S | Vermont AVE #8 | $499,000 | $516 | 2/0,2,0,0 | 968/A | 1982/PUB |
| TWNHS/A | 1127 W | 228th ST #19 | $690,000 | $463 | 3/3,0,0,0 | 1490/A | 1988/ASR |
| SFR/D | 21204 | Broadwell AVE | $699,711 | $610 | 3/2,0,0,0 | 1148/A | 1959/PUB |
| SFR/D | 1158 | Levinson ST | $830,000 | $643 | 3/2,0,0,0 | 1291/A | 1959/ASR |
| SFR/D | 808 | Gian DR | $980,000 | $618 | 4/2,0,0,0 | 1586/A | 1968/ASR |
| SFR/D | 2649 | Dalemead ST | $1,145,000 | $909 | 3/2,0,0,0 | 1259/A | 1953/ASR |
| SFR/D | 24804 | Pitcairn WAY | $1,210,000 | $1,134 | 3/1,1,0,0 | 1067/A | 1950/ASR |
| SFR/D | 2910 | Briarwood DR | $1,450,000 | $708 | 3/3,0,0,0 | 2049/A | 1976/ASR |
| SFR/D | 3001 | Lazy Meadow DR | $1,775,000 | $798 | 3/2,0,1,0 | 2223/A | 1975/PUB |
| TWNHS/A | 2971 | Plaza Del Amo #258 | $760,000 | $642 | 2/3,0,0,0 | 1184/A | 1985/ASR |
| TWNHS/A | 2800 | Plaza Del Amo #225 | $799,000 | $734 | 2/1,1,1,0 | 1088/A | 1988/ASR |
| TWNHS/A | 2800 | Plaza Del Amo #14 | $805,000 | $679 | 2/1,1,1,0 | 1185/A | 1989/ASR |
| SFR/D | 917 | Patronella AVE | $815,000 | $468 | 4/2,0,0,0 | 1743/ | 1951 |
| TWNHS/A | 2047 | Lincoln AVE | $900,000 | $664 | 3/2,0,1,0 | 1356/B | 2023/BLD |
| TWNHS/A | 2800 | Plaza Del Amo #312 | $950,000 | $677 | 3/2,0,1,0 | 1404/A | 1988/ASR |
| SFR/D | 20538 | Amie AVE | $1,150,000 | $760 | 3/1,1,0,0 | 1514/A | 1958/ASR |
| SFR/D | 20550 | Madison ST | $1,210,000 | $673 | 3/2,0,0,0 | 1798/P | 1958 |
| SFR/D | 1719 | Iris AVE | $1,582,000 | $812 | 3/2,0,1,0 | 1948/P | 1957/PUB |
| CONDO | 24410 | Crenshaw BLVD #102 | $510,000 | $459 | 2/2,0,0,0 | 1111/ | 1987 |
| CONDO/A | 22932 | Nadine CIR #B | $545,000 | $488 | 1/1,0,1,0 | 1117/A | 1963/ASR |
| TWNHS/A | 3004 W | 235th ST | $1,039,900 | $591 | 3/3,0,0,0 | 1759/A | 2000/ASR |
| SFR/D | 2553 W | 230th ST | $1,470,500 | $675 | 3/2,0,0,0 | 2178/A | 1960/PUB |
| SFR/D | 2633 W | 230th ST | $1,500,000 | $1,001 | 4/2,0,0,0 | 1499/A | 1960/PUB |
| SFR/D | 22715 | Juniper AVE | $1,700,000 | $712 | 5/3,0,0,0 | 2388/A | 1963/ASR |
| SFR/D | 5600 | Calle De Ricardo | $1,825,000 | $1,198 | 3/2,0,0,0 | 1523/A | 1955/ASR |
| SFR/D | 24900 | Via Valmonte | $2,073,000 | $657 | 3/2,0,1,0 | 3157/T | 1979/ASR |
| SFR/D | 23148 | Ladeene AVE | $1,185,000 | $858 | 3/2,0,0,0 | 1381/A | 1960/ASR |
| SFR/D | 22328 | Kathryn AVE | $1,225,000 | $764 | 3/2,0,0,0 | 1604/A | 1953/PUB |
| SFR/D | 4820 | Macafee RD | $1,225,000 | $644 | 4/1,0,1,0 | 1901/A | 1956/ASR |
| SFR/D | 23540 | Kathryn AVE | $1,350,000 | $736 | 4/1,1,0,0 | 1834/A | 1962/ASR |
| SFR/D | 22502 | Redbeam Avenue | $1,500,000 | $761 | 3/2,0,0,0 | 1970/A | 1952/ASR |
| SFR/D | 23022 | Galva AVE | $1,511,000 | $621 | 4/3,0,0,0 | 2434/A | 1967/ASR |
| SFR | 23107 | Audrey AVE | $2,500,000 | $676 | 5/4,0,1,0 | 3696/A | 1990 |
| SFR/D | 21601 | Marjorie AVE | $1,060,000 | $839 | 4/2,0,0,0 | 1263/A | 1956/PUB |
| TWNHS/A | 4467 | Emerald ST #19 | $955,000 | $600 | 3/2,0,1,0 | 1591/A | 1982/ASR |
| SFR/D | 19922 | Bellemare AVE | $1,140,000 | $695 | 3/1,0,0,0 | 1640/E | 1955/ASR |
| SFR/D | 4910 | Carmelynn ST | $1,250,000 | $622 | 4/2,0,1,0 | 2011/A | 1968/ASR |
| SFR/D | 5633 | Konya Drive | $1,500,000 | $652 | 5/1,1,1,0 | 2300/P | 1959/PUB |
| SFR/D | 5607 | Michelle DR | $1,580,000 | $1,035 | 4/1,1,0,0 | 1526/A | 1959/ASR |
| SFR/D | 4175 W | 172nd ST | $925,000 | $583 | 3/2,0,0,0 | 1586/A | 1951/ASR |
| SFR/D | 4105 W | 184th ST | $935,000 | $777 | 4/2,0,0,0 | 1204/P | 1954/ASR |
| SFR | 3512 W | 187th ST | $938,700 | $773 | 4/2,0,0,0 | 1215/ | 1954 |
| SFR/D | 16714 | Cranbrook AVE | $980,000 | $598 | 4/2,0,0,0 | 1638/A | 1956/ASR |
| SFR/D | 16715 | Glenburn AVE | $1,100,000 | $879 | 3/2,0,0,0 | 1252/A | 1952/ASR |
| SFR/D | 16604 | Patronella AVE | $1,500,000 | $685 | 4/2,0,1,0 | 2189/A | 1976/PUB |
| SFR/D | 2059 W | 160th ST | $780,000 | $932 | 2/1,0,0,0 | 837/A | 1950/ASR |
| SFR/D | 16802 | Kristin AVE | $900,000 | $690 | 3/1,0,1,0 | 1304/P | 1953/PUB |
| SFR/D | 17204 | Atkinson AVE | $955,000 | $764 | 3/2,0,0,0 | 1250/O | 1947/ASR |
| SFR/D | 1859 W | 179th ST | $960,000 | $458 | 4/2,0,1,0 | 2097/A | 1968/ASR |
| SFR/D | 18045 | Atkinson AVE | $1,025,000 | $504 | 4/1,1,0,0 | 2035/A | 1967/ASR |
| SFR/D | 16815 | Wilkie AVE | $1,132,500 | $837 | 3/1,1,0,0 | 1353/A | 1953/ASR |
| SFR/D | 17044 | Spinning AVE | $1,340,000 | $823 | 4/3,0,0,0 | 1628/A | 1956/ASR |
| TWNHS/A | 1242 | Engracia | $550,000 | $786 | 1/1,0,0,1 | 700/P | 2005/BLD |
| SFR | 2061 W | 222nd ST | $630,000 | $1,193 | 1/1,0,0,0 | 528/ | 1923 |
| CONDO/A | 2415 | Arlington | $709,900 | $697 | 2/2,0,1,0 | 1018/B | 2023/BLD |
| SFR | 1324 | Beech AVE | $840,000 | $692 | 2/1,0,0,0 | 1214/ | 1938 |
| CONDO/A | 2349 | Jefferson ST #117 | $915,000 | $598 | 2/2,0,0,0 | 1530/A | 2008/ASR |
| SFR/D | 1016 | Amapola AVE | $1,090,000 | $1,081 | 2/1,0,0,0 | 1008/A | 1924/ASR |
| SFR/D | 1804 | Marinette ST | $1,100,000 | $730 | 3/2,0,0,0 | 1506/A | 1949/ASR |
| SFR/D | 2020 | Gramercy AVE | $1,189,999 | $1,030 | 3/2,0,0,0 | 1155/A | 1912/PUB |
| SFR/D | 1707 W | 238th St. | $935,000 | $452 | 3/1,1,1,0 | 2070/A | 1957/ASR |
| SFR/D | 24255 | Huber AVE | $990,000 | $614 | 3/3,0,0,0 | 1612/A | 1954/ASR |
| SFR/D | 2325 W | 237th ST | $1,155,000 | $752 | 3/1,1,0,0 | 1536/A | 1962/ASR |
| SFR/D | 2268 W | 233rd ST | $1,240,000 | $613 | 3/2,1,0,0 | 2023/A | 1968/ASR |
| SFR/D | 2309 W | 227th ST | $1,459,000 | $684 | 3/3,0,0,0 | 2133/A | 1964/ASR |
| SFR/D | 1923 | W. 233rd | $1,650,000 | $825 | 4/1,1,0,0 | 2001/A | 1973/ASR |